Are you actually getting faster?
Track Day Analysis charts your improvement across every session and season — so progress is something you can measure, not just feel.
Your whole season, in one view
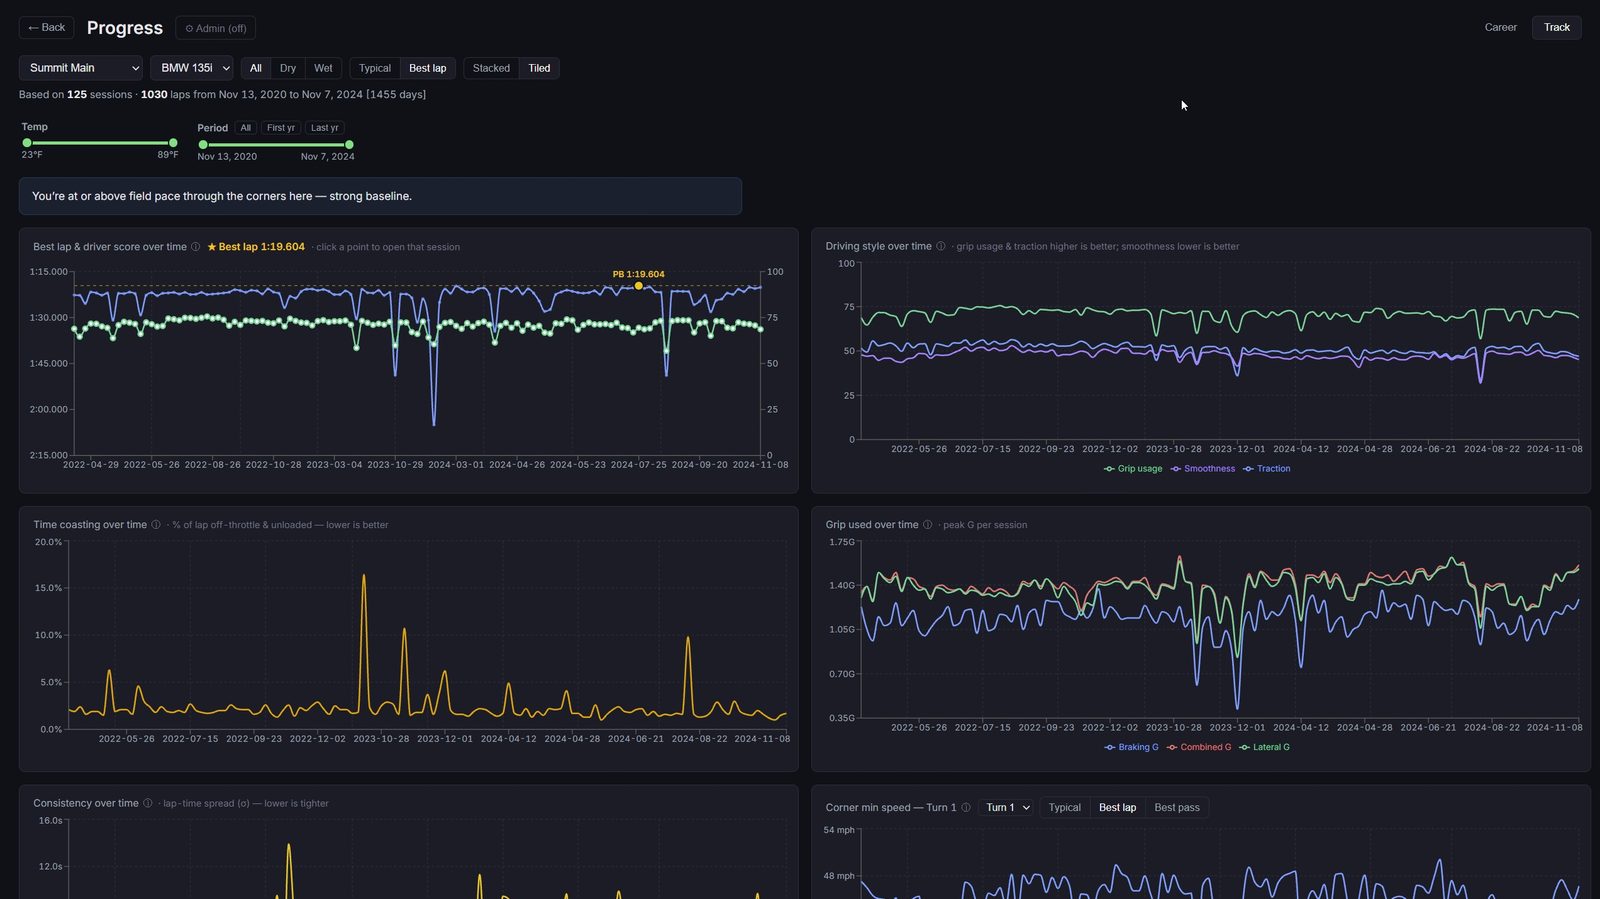
Each session you upload feeds a running picture of your driving. Progress pulls them together — in the example above, 125 sessions and 1,030 laps across four years — so you can see the long arc, not just today's result. Filter by track, car, and conditions (dry/wet, temperature), and zoom to your first year or your last.
The trends that matter
- Best lap & driver score over time — click any point to open that session
- Consistency — lap-time spread per session; tighter is better
- Driving style — grip usage, smoothness, and traction trends
- Time coasting — percentage of the lap off throttle and unloaded
- Grip used — peak G per session over time
- Per-corner minimum speed — turn by turn, so you can see exactly where you've found pace
Honest, field-aware context
Progress compares your pace against the field where it can, so a callout like "you're at or above field pace through the corners here — strong baseline" tells you not just whether you improved, but where you stand and what to work on next.
FAQ
How does progress tracking work?
It aggregates every session you upload and charts trends over time — best lap, consistency, grip usage, coasting, and per-corner speeds — filterable by track, car, and conditions.
Do I need a lot of data to see progress?
Trends get richer the more you upload, but you'll see session-over-session changes right away.
Start measuring your improvement
Upload your sessions and watch the trends build — free.
Get started — free